Capstone Project: Bike-share company analysis
Navigating the Bike Sharing Market: Insights from Data Analysis
Quick Links to Code:
Below I will explain about the story and will give the step by step of the process on collecting and analyzing the data and some of the conclusions and solutions that I arrived. You can also follow along to deeper understand the code in the above links, the first being the GitHub post about this project, and the link page being the Kaggle post about the project.
Background
The bike sharing industry has rapidly grown in recent years, providing a convenient and environmentally friendly mode of transportation. However, with the increase in competition, it’s becoming increasingly important for bike sharing companies to understand the needs and habits of their customers in order to stay ahead of the curve.
In this project, the main asks were :
1 . How annual members and casual riders use Cyclistic bikes differently because the company want to increase the number of annual members.
2 . The director of marketing, believes that the future of the company depends on maximizing the number of annual memberships.
So I started the analysis working with python to better understand the behaviour of those two groups to see how to improve the adoption of memberships, and how to better segment members.
The data is available trough the link: https://divvy-tripdata.s3.amazonaws.com/index.html. In this instance the data analyzed was from September 2021 to September 2022 to see the patterns emerging throughout the year. The data is ROCCC because it’s reliable, original, comprehensive, current and cited. The company has their own licence over the dataset. Besides that, the dataset doesn’t have any personal information about the riders.
Data Exploration and Preparation
The first step in my analysis was to explore and prepare the data. Once the data was available in multiple CSV files, each with 1 month of data, that was all uploaded and condensed into one data frame.

In the image to the left, we can see that the data was not in the correct format, once startet_at and ended_at, both time variables are Object data types, and needed to be transformed into datetime, to be better analyzed and explored.
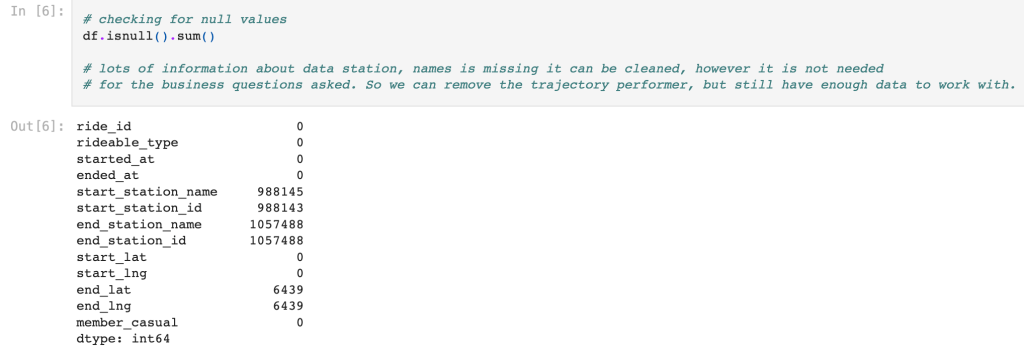
Besides that, I ran the code below to check for null values of the full dataframe. It was noted that the name of the stations, and Ids, of both starting and end station were missing in a significant manner ( 15% missing values (988,145 missing data points out of 6,584,382 total).
For end_lat and end_lng (latitude and longitude coordinates) it was had only a small fraction missing, so it can still be used and represent with a valid manner. So from all of this, ride_id, rideable_type, started_at, ended_at, started_lat, started_lng, end_lat and end_lng were used, and the rows that there were null values, it was dropped from the analysis.
Data Transformation
After checking the data that was available. The transformation from object data typo to datetime, and creating new variables for day of week, so we can analyze habits for week days and weekend of casual riders and members, month and year, so we can better visualize the pattern through the year and to see the if the seasons have a significant impact on the frequency of riders.
Another key data transformation was to create start and end coordinate variables, with a tuple with the start_lat and start_lng and end_lat and end_lng so we can later on use the geopy library to calculate the distance of each trip, taking into consideration the start and end coordinates as it can be seen in the below code. A function was created so that the function can loop trough all trips in the dataframe and another variable distance_km to be created.

Data Analysis and Visualization
Once I had all the dataframe all processed and transformed to be analyzed, the visualizations and deeper analysis began. Firstly I created pivot tables that showed the relationships between : ride duration through the months from members vs casuals , ride duration trough the days of the week, number of trips and types of bikes used and the one below which shows the distance from users throughout the week.

In there we can already have an Idea that members have a more consistent usage of the bikes during the week days than casual riders (which indicates a predefined route, like a commute) and casual riders have a little longer ride in general, but even more so on the weekends.
Another step, was to create visualization to better understand and see the patterns of differences between the users in this manner. It is a critical step, once if the right information is inputted, we can see more clearly the relationships. Once the months and count trips were inputted we could clearly see a pattern emerging.
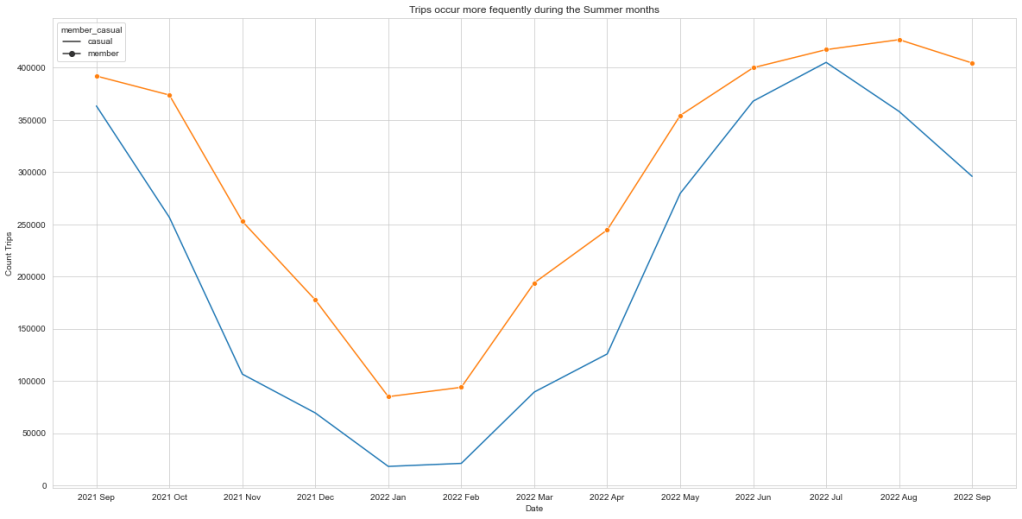
It is clear that trips occur more often during the Summer months, from May until October, for both casual riders and members. With this analysis, it demonstrate that a lot of riders may not be inclined to have an annual membership, once they already know it would no be a service that they will use year around, but having a summer membership may attract more casual riders to join the bike-share program.
Another very interesting visual was created demonstrating the relationship between trips done and day of the week by members and casual riders, as seen below.
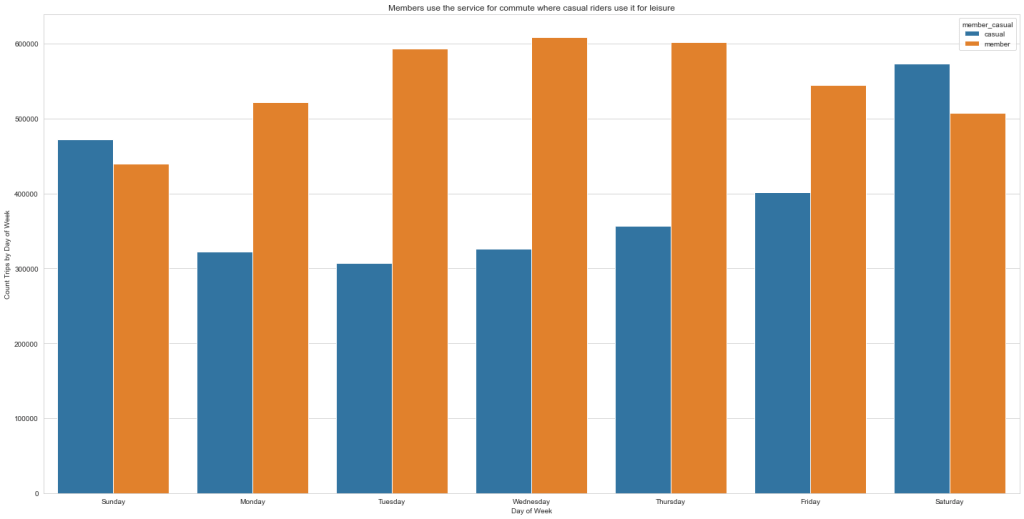
With members riding more often during the week days and casual riders using the bike-share more often during the weekend, it becomes clear that members use it for commuting, while casual riders use it for leisure during non business days. With this information, creating a weekend plan for leisure and people looking to be more active during their non business days would attract another portion of casuals.
Conclusion
In this project, thanks to a good job preparing and performing the necessary transformations on the data, in the last portion of analyzing and visualizing the data I could have a better understanding of the differences between members and casual riders, and promote new ideas to increase the number of memberships, a few are listed below:
- Member riders can be seen riding more often during the week with shorter duration time, most likely showing that they are using the bike share for their daily commute, where the casual riders are using the bikes more frequently on the weekend, and with longer duration than the members, which shows that the casual riders are using the bike for leisure, and without rush, compared to the members.
- Summer months from May to October are more popular and company can focus on this period to maximize their profits. Special ‘Summer Membership’ can be introduced specifically for casual riders who’re hesitant to go for annual membership.
- Have memberships for Casual riders based on the duration of the trips, since Casual riders go on average above 20 minutes every day of the week that they ride having a membership based on longer duration would be interesting for the “leisure” type of riders.
- Developing a “weekend membership” can drive conversion from Casual riders to members, since casual riders go more frequently and longer during the weekend, that can be a good entry point to convert the casual riders to members of the bike-share program.
